

You've finished a test on a metabolic cart. The client has stepped off the treadmill, the mask is off, and the software has handed you a dense export full of VO2, VCO2, ventilation, heart rate, RER, and stage-by-stage values. That's the point where many practitioners stall. The test is done, but the useful work hasn't started yet.
Raw numbers don't change training plans, rehab pacing, or nutrition targets. Metabolic data analysis does. It turns a printout into a physiological profile you can use. It tells you whether the client's aerobic base is underdeveloped, whether their pacing is too aggressive, whether their resting energy needs are lower than expected, or whether a retest reflects adaptation or just poor test control.
That matters if you're trying to prescribe more precisely and avoid generic advice. In weight management, for example, better decisions often come from moving beyond generic calorie deficit formulas and working from measured physiology rather than assumptions. It also matters if you want your reports to show real progress over time, not just a collection of disconnected metrics. A good testing workflow becomes much more useful when it sits alongside a consistent process for tracking fitness progress over time.
Table of Contents
- From Raw Numbers to Actionable Insights
- Sourcing Your Metabolic and Physiological Data
- Cleaning and Preprocessing Your Raw Data
- Core Metabolic Analysis Techniques Explained
- Recommended Software and Analysis Workflows
- Interpreting Results for Clients and Athletes
- Common Pitfalls and Professional Reporting
From Raw Numbers to Actionable Insights
Most practitioners don't need more data. They need a cleaner interpretation process.
A metabolic cart, a Chester Step Test protocol, or a body composition tool can all produce useful outputs. But data collection and data analysis aren't the same thing. Collection gives you measurements. Analysis tells you what those measurements mean in the context of the person in front of you.
That difference is where practitioners either become trusted interpreters or stay stuck as test operators. A printout with breath-by-breath values looks impressive, but clients don't buy complexity. They buy clarity. They want to know what to do next week, what to change in training, how to pace, how to fuel, or why progress has stalled.
What actionable analysis looks like
Useful metabolic data analysis usually answers a short list of practical questions:
- How hard was the effort really? Heart rate alone often misses the full picture.
- Where do the client's sustainable training zones sit? That's central for endurance work and rehab progression.
- What fuels are likely dominating at different intensities? RER trends help here.
- Are changes over time believable? Only if the testing conditions and preprocessing were controlled.
- What intervention should change because of these results? If nothing changes, the analysis hasn't done its job.
Practical rule: Every graph or metric in your report should earn its place by changing a decision.
The strongest reports don't dump every variable the software exports. They reduce the noise, keep the patterns that matter, and connect those patterns to a plan. In practice, that means pairing measured physiology with context: training history, medications, sleep disruption, body composition trend, rehab stage, and the exact protocol used.
That's the core value of metabolic data analysis. It doesn't just describe physiology. It helps you prescribe with less guesswork.
Sourcing Your Metabolic and Physiological Data
A client finishes a treadmill test with a neat PDF, a heart rate trace, and a VO2 peak estimate. The report looks clean. The key question is whether the numbers came from a setup you would trust enough to change training load, nutrition targets, or rehab progression.

Indirect calorimetry in practice
For direct physiological measurement, indirect calorimetry is still the standard I would use first in most applied settings. Systems such as Cosmed metabolic analysers collect breath-by-breath gas exchange and give you oxygen uptake, carbon dioxide production, ventilation, and derived outputs such as energy expenditure and RER.
Those variables matter because they change decisions. In performance work, they help set training zones, check exercise economy, and judge whether an athlete reached a meaningful peak effort. In clinical work, they help you spot poor tolerance to workload, exaggerated ventilatory drift, or an unstable resting measurement that should not be used to guide intake or activity advice.
Precision comes with a price. Good gas analysis depends on calibration, mask fit, environmental control, technician consistency, and a protocol that matches the person in front of you. A badly chosen ramp rate or a mask leak can distort interpretation just as easily as poor effort.
Field tests and supporting measures
Lab data is not always the right tool for the job. The Chester Step Test works well when you need a structured submaximal assessment in occupational health, education, physiotherapy, or team settings where maximal testing is unrealistic, poorly tolerated, or unnecessary.
The trade-off is straightforward. You lose detail compared with indirect calorimetry, but you gain speed, lower cost, easier repeat testing, and less burden on the client. In many services, that trade-off is sensible, especially when the goal is trend monitoring rather than fine-grained threshold analysis.
Useful supporting inputs include:
- Body composition measures, including ultrasound where available, to add context to energy expenditure and weight-change interpretation.
- Wearables to track day-to-day patterns in heart rate, sleep, movement volume, and recovery behaviour.
- Session notes to capture medication changes, menstrual cycle phase, illness, travel, poor sleep, and adherence issues that often explain odd results.
If you're building a wider assessment setup, it helps to compare health monitoring devices for applied practice so each tool has a clear job instead of forcing one device to answer every question.
Good metabolic analysis starts at data collection. Protocol choice, environment, and equipment setup determine whether the spreadsheet supports a sound decision or just looks technical.
The same principle applies outside exercise physiology. Labs and analytics teams that use proven data quality strategies get more consistent outputs because they standardise collection before they standardise interpretation. That is the practical lesson here as well. Use the right test for the setting, control what you can, document what you cannot, and treat source quality as part of the analysis rather than a separate admin task.
Cleaning and Preprocessing Your Raw Data
A client finishes a resting test on the Cosmed. The report looks tidy. Then you notice they coughed twice, shifted position, and spoke to ask how long was left. If those breaths stay in the file, the error is no longer in the equipment. It is in the interpretation.
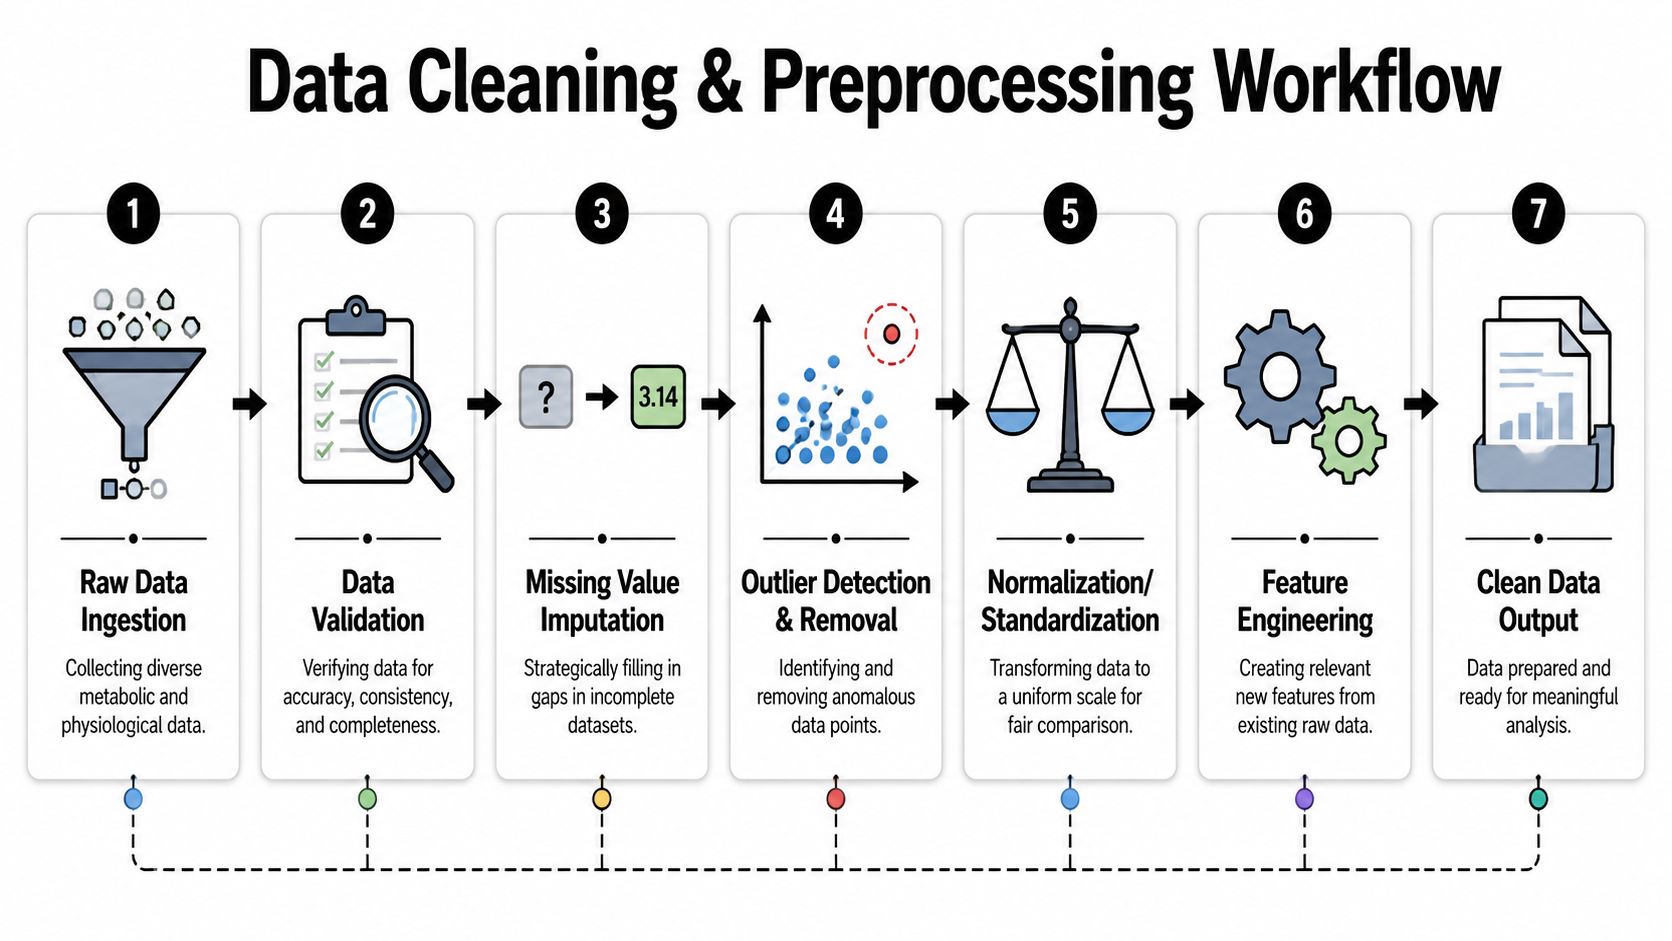
Breath-by-breath metabolic data always needs screening before analysis. Resting tests pick up movement, fidgeting, poor settling, and occasional leaks. Exercise tests add cadence changes, swallowing, handrail contact during a Chester Step Test or treadmill protocol, and short spikes that have nothing to do with true physiology. Raw export files are a starting point, not a result.
What to fix before you interpret anything
Start by checking whether the file matches the session that happened. Test notes matter here. If the client broke rhythm in stage three, gripped the rails, adjusted the mask, or talked during a resting measure, that context needs to sit beside the numbers.
Then inspect the signal itself.
- Verify the session notes. Notes often explain odd values faster than the graph does.
- Flag obvious artefacts. Single-breath surges in VO2, VCO2, or ventilation are usually noise unless they repeat in a clear pattern.
- Check continuity across the file. Gaps, flatlines, or abrupt shifts can indicate sampling issues, software dropouts, or analyser problems.
- Confirm time alignment. Heart rate, workload, speed, cadence, and gas exchange should rise and fall in a way that fits the protocol.
- Check the first minutes separately. Early resting data and the opening stage of exercise tests often reflect settling, not steady physiology.
This matters in both clinical and performance work. In a fat-loss case, a few contaminated minutes can distort resting metabolic rate enough to push calorie targets in the wrong direction. In threshold work, poor cleaning can shift where you place VT1 or VT2 and change the training zones you give an athlete. The practical question is always the same. Does this segment reflect physiology, or does it reflect the test setup?
A practical preprocessing order
A usable workflow for applied practice is straightforward:
- Remove contaminated periods first. Exclude coughing, swallowing, speaking, mask adjustment, and clear protocol breaks.
- Trim unstable start periods where justified. Resting tests usually need a settling period removed before averaging.
- Apply smoothing with restraint. Short averaging windows can make breath-by-breath traces usable without erasing real transitions.
- Standardise comparisons. If you are comparing across systems, dates, or protocols, use the same cleaning rules each time.
- Log every exclusion. If a segment comes out, record what was removed and why.
- Review analyser setup history. Good cleaning cannot rescue poor hardware preparation. A consistent metabolic cart calibration routine reduces how much correction you need later.
Over-cleaning is just as problematic as under-cleaning. Heavy smoothing can flatten threshold markers, hide inefficient breathing patterns, and make stage responses look more stable than they were. Too little cleaning leaves enough noise to skew averages, respiratory exchange ratio, and energy expenditure estimates.
I use a simple standard in clinic and performance testing. If I cannot defend a breath, a stage, or an averaged segment in front of a coach, doctor, or athlete, it should not shape the recommendation.
For teams building a more reliable process around this stage, these proven data quality strategies are useful because the habits transfer well to physiological testing. Set validation rules, document exceptions, and apply the same preprocessing standard every time.
The aim is to make the signal honest enough to support a real decision.
That is the bridge between theory and practice. Clean data does not just improve a graph. It improves the advice you give after the test.
Core Metabolic Analysis Techniques Explained
A coach brings you a Cosmed printout after a ramp test. A clinician has a Chester Step Test estimate from last week. An athlete wants one answer from both. The job here is to turn different metabolic signals into a decision you can defend.

The questions that matter clinically and in performance
The analyses that earn their place in practice are resting metabolic rate, VO2max or estimated aerobic capacity, ventilatory thresholds, substrate utilisation, and exercise energy cost. Each one answers a different operational question.
Resting metabolic rate supports energy prescription, but only if the test conditions were controlled well enough to trust the number. In clinic, I use it most in weight management, RED-S risk review, return-to-training, and cases where predictive equations are too rough to guide intake. Context changes the meaning. A suppressed resting value after chronic dieting or poor sleep points to a different intervention than the same value in a stable client with consistent intake. For practitioners building nutrition plans, this overview of optimizing fat loss using RMR is a useful companion because it keeps the discussion tied to measured need.
VO2max is a useful ceiling marker. It is not a full performance profile. A direct value from a Cosmed cart usually gives more confidence than a field estimate, but an estimated result from a Chester Step Test can still be good enough for screening, baseline tracking, and rehab settings where maximal testing is not appropriate. The trade-off is precision versus practicality.
Ventilatory thresholds usually carry more programming value than peak VO2. They help set easy, moderate, and high-intensity work with more accuracy than generic percentage zones. In cardiac rehab, respiratory rehab, and deconditioned populations, threshold-based progression is often safer because it reflects how the person is tolerating work, not how a formula says they should.
RER-derived substrate use links physiology to fuelling. If carbohydrate reliance rises early in a graded test, that can reflect poor aerobic development, poor pacing, low glycogen availability, or simple protocol mismatch. The number only becomes useful when you read it against workload, heart rate, ventilation, and stage duration.
Economy or exercise energy cost answers a different question again. Two athletes can show similar VO2max values and perform very differently because one uses less oxygen at a given pace or power. In practice, that matters for runners trying to hold race pace, team-sport athletes building repeat-effort capacity, and clinical clients who fatigue early during ordinary tasks.
Why single metrics often mislead
Single-metric reporting causes a lot of bad decisions.
A client can raise threshold speed with little change in peak oxygen uptake. An athlete can post a better VO2max while showing worse economy and earlier carbohydrate dependence. A resting test can produce a clean-looking average even though the person never reached a stable resting state.
That is why multivariate thinking matters. A review of multivariate methods in metabolomics reported that PCA and PLS-DA were used in over 70% of studies published since 2010, and that PCA can explain up to 90% of variance by projecting complex datasets onto principal components. The practical lesson for exercise physiology is straightforward. Useful interpretation usually comes from reading several variables together, not from promoting one headline number.
A practical interpretation stack often looks like this:
| Analysis focus | What it helps you decide | Common mistake |
|---|---|---|
| RMR | Daily energy target and deficit planning | Treating one resting test as permanent |
| VO2max or estimated capacity | Broad aerobic ceiling | Prescribing zones from this alone |
| Ventilatory thresholds | Training intensity distribution | Ignoring protocol quality |
| RER trend | Fuelling and substrate interpretation | Reading isolated points without stage context |
| Economy or energy cost | Pacing and workload efficiency | Comparing unlike protocols |
If a conclusion depends on one variable only, it usually needs another pass.
Recommended Software and Analysis Workflows
A treadmill test finishes, the Cosmed export lands on your desktop, and the analysis begins. The useful question is not which platform has the longest feature list. It is which workflow lets you clean the file, check test quality, compare it against prior tests, and turn the result into a decision you can defend.
Choosing the right workflow for your setting
For routine exercise testing, the manufacturer platform is usually the right first step. Systems such as OMNIA are built for capture, calibration prompts, breath-by-breath display, and standard report generation. In a busy clinic or performance lab, that matters because the best workflow is often the one staff can run correctly under time pressure.
The trade-off is flexibility. Manufacturer software is good at running the test and producing a first-pass summary. It is less useful when you want to compare repeated tests across a squad, standardise cleaning rules across multiple operators, or combine metabolic data with lactate, wellness, GPS, or strength data.
MetaboAnalyst is more relevant once the work moves beyond day-to-day exercise testing and into wider metabolomics or integrated physiology analysis. A 2023 metabolomics workflow summary noted that MetaboAnalyst, launched in 2009, had processed over 1 million jobs by 2023 and supports univariate statistics, PCA, PLS-DA, pathway analysis, biomarker work, and both targeted and untargeted datasets. That is useful in research and high-detail projects, but it is usually more than a private coaching setup needs for weekly client reporting.
R and Python give the most control. They also ask the most from the practitioner. If you are handling repeated Chester Step Test data, batch Cosmed exports, or mixed clinical datasets, scripting starts to pay off because preprocessing, flagging rules, plots, and report templates can be standardised. If only one person in the team can maintain the code, the workflow becomes fragile fast.
A practical setup for many services uses three layers. Collect and check the test in the manufacturer software. Export selected variables into a spreadsheet for quick review or into R or Python for repeatable cleaning and visualisation. Build the client-facing report separately, using only the variables that change programming, fuelling, pacing, or referral decisions.
Cartwright Fitness supplies validated testing equipment and related software for practitioners using tools such as Cosmed analysers, Chester Step Test systems, and BodyMetrix devices. That matters for teams that want equipment support and workflow guidance from the same provider rather than piecing systems together from multiple vendors.
Metabolic Data Analysis Software Comparison
| Tool | Primary Use Case | Learning Curve | Key Feature |
|---|---|---|---|
| Manufacturer software such as OMNIA | Test capture and routine reporting | Low to moderate | Direct integration with analyser hardware |
| MetaboAnalyst | Advanced metabolomics and multivariate analysis | Moderate | Web-based workflow with broad statistical modules |
| R | Custom analysis and reproducible research pipelines | High | Full control over cleaning, modelling, and visualisation |
| Python | Custom workflows and integrated data processing | High | Flexible scripting across multiple data sources |
| Spreadsheet-based workflow | Small-scale applied practice | Low | Fast review and simple reporting for straightforward cases |
The common mistake is choosing software that looks impressive rather than software that fits the service. If the team cannot run the workflow consistently, audit the steps, and explain the output in plain language, it is the wrong setup.
Interpreting Results for Clients and Athletes
The report only becomes valuable when it changes behaviour. That's where many technically good assessments fall flat.
Case example for an endurance athlete
An endurance athlete completes a graded treadmill test on a Cosmed system. The headline number looks good enough, but the more useful finding sits lower down the intensity range. Their breathing pattern changes earlier than expected, RER rises quickly once pace lifts, and the crossover toward heavier carbohydrate reliance appears sooner than their race goals would suggest.
The practical message isn't “your fitness is bad.” It's more precise than that.
I'd frame the interpretation like this:
- Aerobic durability needs work. The athlete can produce hard efforts, but the sustainable zone is narrower than it should be.
- Training zones need tightening. Generic heart-rate bands may be pushing too many sessions into moderate-to-hard work.
- Race fuelling should match the physiology. If carbohydrate dependence rises early, under-fuelling long sessions becomes riskier.
- Pacing needs restraint early. The athlete may be burning matches too soon rather than lacking top-end ability.
That turns one test into a revised training week. Easy sessions stay easier. Threshold work becomes more deliberate. Long sessions get fuelling practice instead of being treated as simple mileage.
“Clients don't need every variable explained. They need to know what to keep, what to change, and why.”
Case example for a weight management client
A clinical weight management client comes in after several months of inconsistent progress. They've been following calorie targets based on standard formulas, but energy levels are poor, adherence is slipping, and exercise feels disproportionately hard.
Their resting metabolic test gives you a measured anchor instead of a guessed one. Combined with exercise response, body composition trend, and recent lifestyle history, the interpretation becomes more nuanced than “eat less and move more.”
The discussion might sound like this:
- The current intake target may not reflect the client's actual measured resting needs.
- Training intensity may be too high for consistent adherence, especially if sessions repeatedly drift into uncomfortable zones.
- Day-to-day fatigue and appetite swings matter because they affect adherence more than theoretical calorie precision.
- Follow-up testing should look for direction of change, not perfection from one snapshot.
For this client, actionable advice often includes a more realistic deficit, more controlled aerobic work, clearer recovery targets, and a retest scheduled under similar conditions. The report becomes a decision tool, not just a diagnostic summary.
A good interpretation also protects the client from overreacting. If one number is slightly lower than expected, that doesn't automatically mean “damaged metabolism.” It may mean poor sleep before the test, low recent intake, anxiety during the assessment, or simple day-to-day variation. Professional interpretation keeps the message grounded.
Common Pitfalls and Professional Reporting
Good testing loses value quickly when interpretation gets sloppy. Professional credibility depends on being careful with both analysis and communication.
Mistakes that weaken good testing
Some errors show up repeatedly in metabolic data analysis:
- Treating RER above 1.0 as a simple fat-versus-carb metric. At higher intensities, interpretation gets more complicated.
- Calling a resting value definitive without a real steady state. If the client never settled, the number is on shaky ground.
- Overrating VO2max. A single peak number doesn't replace threshold, economy, symptoms, and training context.
- Ignoring protocol differences between tests. If setup or stage design changes, comparison becomes less reliable.
- Reporting every metric the software exports. More pages don't mean more insight.
A report should show judgement, not just data transfer.
A report structure that clients and referrers can use
A strong report is usually short, clear, and easy to scan. I'd include:
Client details and test conditions
Date, protocol, equipment used, and any factors that could affect interpretation.Key findings
Resting result or exercise summary, threshold observations, substrate trends, and notable response patterns.Visuals that support decisions
Simple charts such as heart rate against VO2 or stage progression against RER.Interpretation in plain English
What the data means for training, rehab, pacing, fuelling, or energy prescription.Action points
Specific next steps, not vague encouragement.Retest notes
What needs to stay consistent next time so the comparison means something.
The standard should be simple. If a client can't explain the main finding back to you, the report is too technical. If another practitioner can't see how you reached the conclusion, it's too vague.
If you're building or refining a testing setup, Cartwright Fitness offers validated equipment for metabolic analysis, Chester Step Test delivery, body composition assessment, and related workflows used in clinical, academic, and performance settings.