

A borderline grip score causes trouble fastest when someone reads it as a single number instead of a position on a distribution. In an occupational report, that mistake can turn a perfectly plausible result into a false concern, or hide a weak performance near the lower tail. The grip dynamometer bell curve fixes that problem by putting the score back into a reference population, then forcing the usual questions about age, sex, protocol, and device before anyone signs off on the result.
That matters in practice because grip is used differently across settings. In some clinics it supports screening and referral, in others it helps with return-to-duty decisions, and in research it sits beside anthropometry, metabolic testing, and functional assessment. The safest interpretation is rarely “good” or “bad” on its own, it's “good for whom, measured how, and compared with which curve.”
Table of Contents
- Introduction to Grip Dynamometer Bell Curves in Professional Practice
- What a Grip Strength Bell Curve Shows and Why It Matters
- UK Normative Data and How Age Sex and Anthropometry Shape the Curve
- How Device Type and Protocol Affect Comparability of Bell Curves
- How to Create a Valid Grip Strength Bell Curve for Your Population
- How to Read and Interpret Centiles Z Scores and Standard Deviations
- Clinical and Occupational Cutoffs and When to Use Them
- Quick Reference Toolkit Cross References and Professional Resources
Introduction to Grip Dynamometer Bell Curves in Professional Practice
A physiotherapist hands over a report, the occupational health lead reads 31 kg on dominant-hand grip, and the room goes quiet because the number looks borderline. Without context, that score can be over-read as weak, average, or acceptable, depending on who's looking and what standard they have in mind. With a bell curve, the same figure becomes a distributional question, where the issue is whether the score sits where a person of that sex, age, and measurement protocol should sit.
Why the curve matters in day-to-day reporting
Professional practice needs more than a raw force value. A grip score only becomes useful once it's matched to the right reference distribution, because the UK evidence base shows that age- and sex-specific centiles are more defensible than one flat average, and that the dynamometer type matters enough to document carefully in the report (PLOS One UK normative paper). That is especially true in occupational health, where a near-threshold result can change the next step, and in rehabilitation, where the trend is more informative than the isolated number.
The practical reader also needs a curve that reflects the tested population, not a generic internet chart. UK reference data have been built from large general-population studies, including the broad British dataset used in life-course normative curves, and later extended by a very large UK Biobank analysis for adults aged 39 to 73 years (UK Biobank normative values). Those datasets support a more disciplined habit, comparing the person with the right people, measured in the right way.
Practical rule: if the device, posture, hand tested, or repetition rule doesn't match the reference, the score is no longer on the same curve.
What this guide gives the professional reader
The useful questions are straightforward. Which UK norms are strong enough to trust, how should centiles be read, when should a service use a pass fail standard, and when does the bell curve belong in the report at all? The answer changes with the setting, but the discipline doesn't. A grip result should always be reported against the matched protocol, then interpreted against the appropriate population distribution.
That approach fits occupational screening, sports science, and clinical physiology because it turns a force reading into an auditable decision. It also fits broader testing programmes where grip is one element among the Chester Step Test, back and leg dynamometry, body composition, and anthropometry, rather than a standalone verdict. The rest of the discussion follows that same logic, starting with what the bell curve shows, then moving into UK norms, device comparability, and practical interpretation.
What a Grip Strength Bell Curve Shows and Why It Matters
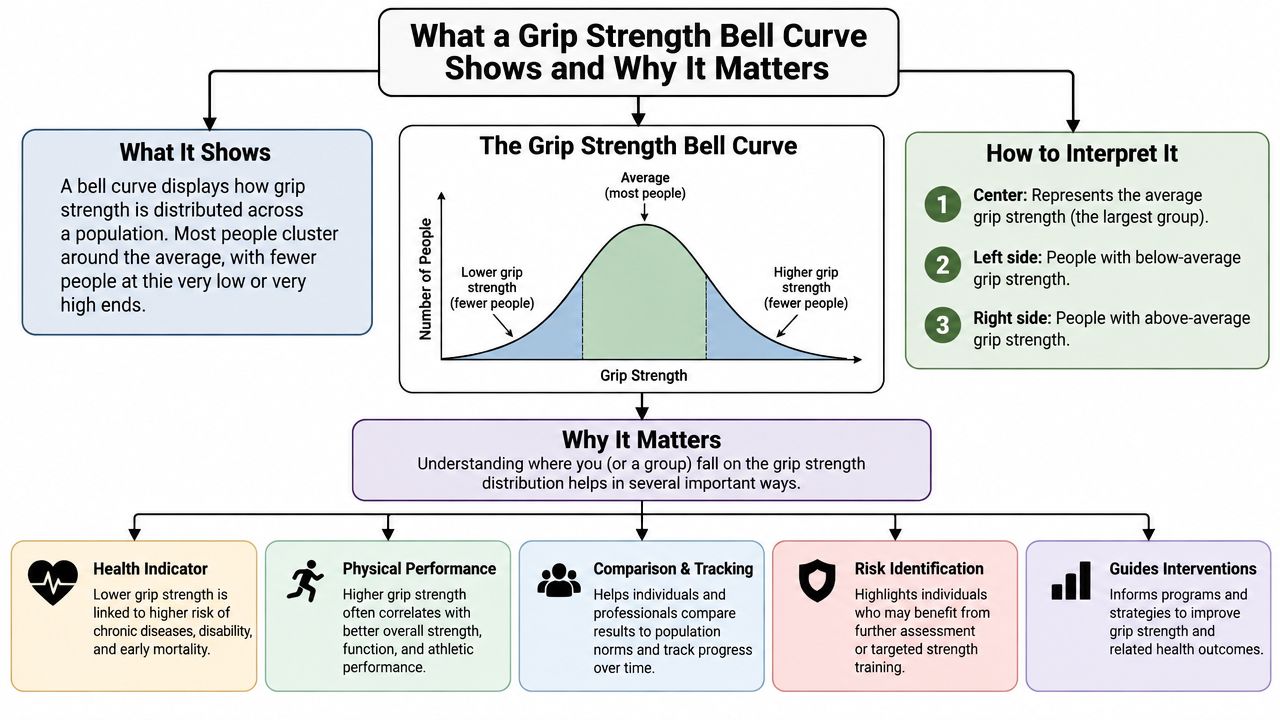
A bell curve is just a way of showing how a group's scores spread out around the centre. In grip testing, the horizontal axis holds the force values, and the vertical shape shows how many people land at each level. Most healthy people cluster in the middle, while fewer sit in the tails, which is why a single average rarely tells the whole story.
Mean, median and the tails
The mean is the arithmetic average, the median is the middle score, and the tails are the low and high ends of the distribution. In a perfectly symmetrical dataset, mean and median sit close together, but real grip data often come from mixed ages, sexes, body sizes, and test protocols, so the shape can shift. That's why practitioners shouldn't treat the peak of the curve as a universal target, especially when the reference sample is only valid for a particular population.
A theoretical bell curve describes what an ideal normal distribution looks like. An empirical distribution is what the tested sample produced. Those aren't the same thing, and the distinction matters because a real-world dataset can look slightly skewed, wider, or narrower depending on who was measured and how.
Why the average misleads
A single average hides useful variation. A grip score can be perfectly ordinary for an older woman and low for a younger man, even if both people have the same kilogram value. That is why professional reports should anchor the result to the right reference band, not just to a broad “normal” label.
The Takei Hand Grip Dynamometer is described by the supplier as an easy to use and accurate test for strength levels, with a fully adjustable isometric design for accurate and reproducible grip strength evaluation, a measuring range of 5.0 to 100kgf, and the ability to display maximum measured values. In a protocol-controlled setting, that kind of device is useful because it supports repeatable comparisons across people and across time.
A bell curve only helps if the score belongs to the same measurement world as the reference curve.
For practitioners, the best practical question is not “Is the number high?” It's “Where does this person sit in the distribution that matches the test conditions?” That question protects against overcalling weak performance, and it also protects against missing a meaningful low tail result in screening or rehabilitation.
UK Normative Data and How Age Sex and Anthropometry Shape the Curve
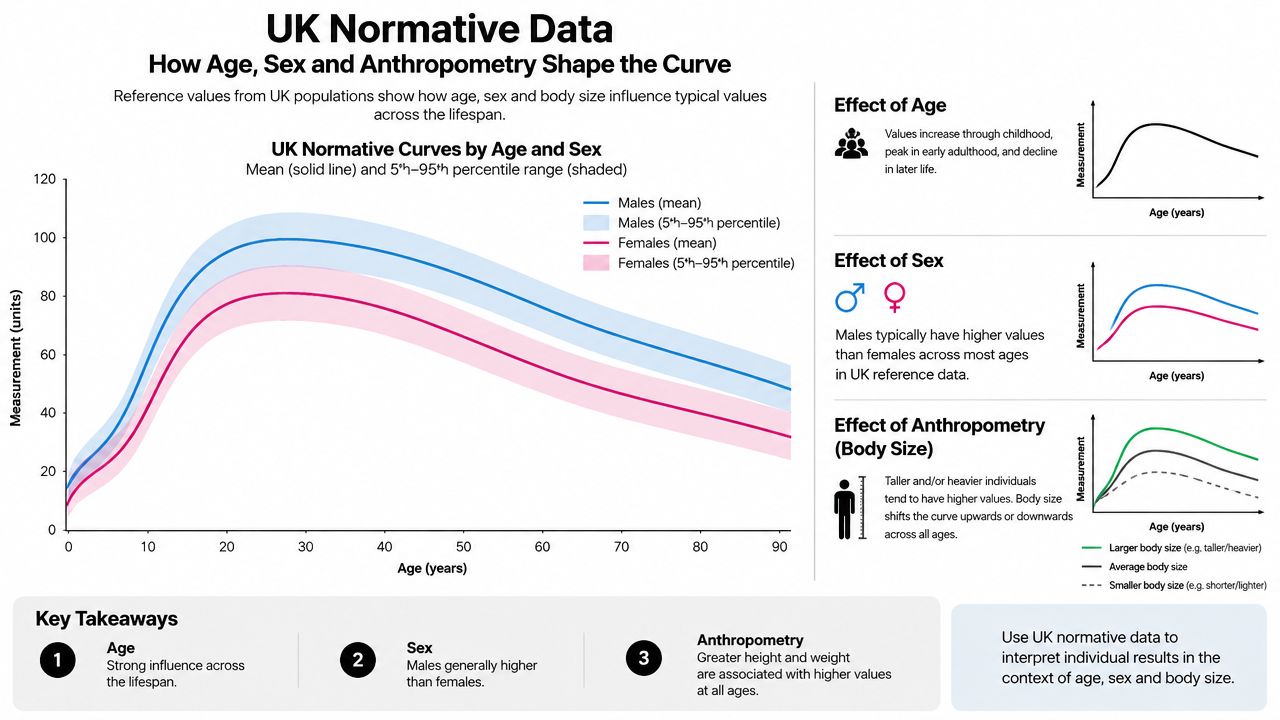
The UK literature makes one point very clearly, grip strength is not a single standard. The 2014 PLOS One paper pooled data from 12 British studies, with 12,389 participants measured between 1908 and 2012, and concluded that different dynamometers used in UK research produced acceptably similar normative data across the observed age ranges (PLOS One UK pooled analysis). That breadth matters because it supports age- and sex-specific centiles rather than one flat average for everyone.
Why one curve is not enough
In practice, sex, age, height, and the hand tested all shift the expected score. The more recent UK Biobank analysis extended that logic by deriving new normative values from 224,830 right-hand measurements and 224,852 left-hand measurements after exclusions, then reporting a final reference sample that was 54.2% women, with a mean age of 55.0 years, mean height of 169.0 cm, and mean BMI of 26.9 kg/m² (UK Biobank normative values). Those values were intended for men and women aged 39 to 73 years, which makes them particularly relevant for working-age and older-adult assessment.
That is exactly why the grip dynamometer bell curve should be stratified. If a service uses one pooled curve for all adults, the lower tail will be too blunt, and borderline cases can be pushed into the wrong interpretation. The bell curve should reflect the demographic group that produced it, not a convenient average.
What to match before interpreting
The reference group needs to be close enough to the person being tested for the comparison to be fair. The British evidence base supports centile curves by sex and age, and the UK Biobank work shows that contemporary norms can be refined further by anthropometry and side. For practical use, that means the assessor should know whether the reference curve is built for the dominant hand, whether it applies to the tested age band, and whether the population resembles the case being reported.
The UK grip strength norms resource is relevant here because it sits in the same practical space as the published literature, namely matching a grip score to a usable reference framework rather than guessing from a raw number.
Reporting discipline matters: the wrong norm can move a score from “expected” to “borderline” without the person changing at all.
That's why age and sex stratification isn't an academic preference. It's the difference between a defensible occupational report and a misleading shortcut.
How Device Type and Protocol Affect Comparability of Bell Curves
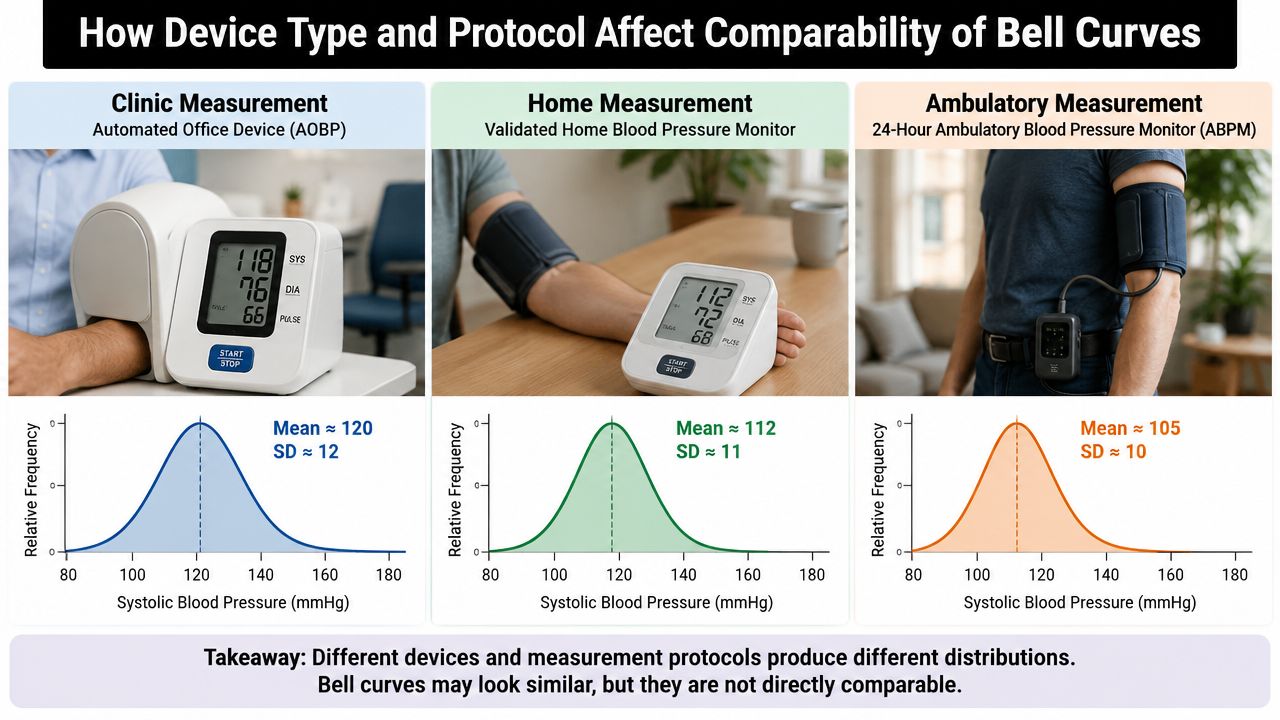
Device choice and protocol can move a grip score enough to matter near the lower tail. The UK pooled analysis reported use of Jamar, Smedley, Nottingham electronic and Takei dynamometers, and found acceptably similar normative data across those device types and between seated and standing positions when the protocol was controlled (PMC analysis of British grip strength studies). That is reassuring, but it doesn't mean devices are interchangeable without thought.
What must be matched
A defensible bell curve depends on matching the reference to the actual test conditions. In practice, that means the assessor should document:
- Device model, because the instrument needs to match or closely resemble the norm set used.
- Posture, seated or standing, because the British literature found comparability only when the position is controlled.
- Hand tested, because the right and left hands don't belong on the same assumption.
- Trial rule, because many protocols use repeated trials and then take the maximal value for the dominant hand.
If any of those elements differ, the score may slide within the distribution enough to affect the interpretation. That's especially important when the result sits close to a screening threshold or a workplace minimum.
Why small differences still matter
The UK evidence says differences between dynamometers and positions are small enough that cross-study norms remain usable, but “usable” is not the same as “ignore the protocol”. A borderline score in occupational screening can change category if the hand was tested once instead of repeatedly, or if the reference curve was built from a different instrument. The lower tail is where that problem bites hardest.
For teams that test repeatedly across clinics, a standardised workflow is more important than brand preference. The dynamometer grip strength test page is relevant as a practical equipment reference because the issue is not buying a device, it's using one with a clearly defined measurement process that can be repeated and defended in audit.
If the report doesn't say what was held, how it was held, and how many times it was tested, the curve is harder to trust.
A good report names the device and the protocol together, then uses the matched norm set. That simple habit stops a service from accidentally comparing one type of test with another and calling the difference biological.
How to Create a Valid Grip Strength Bell Curve for Your Population
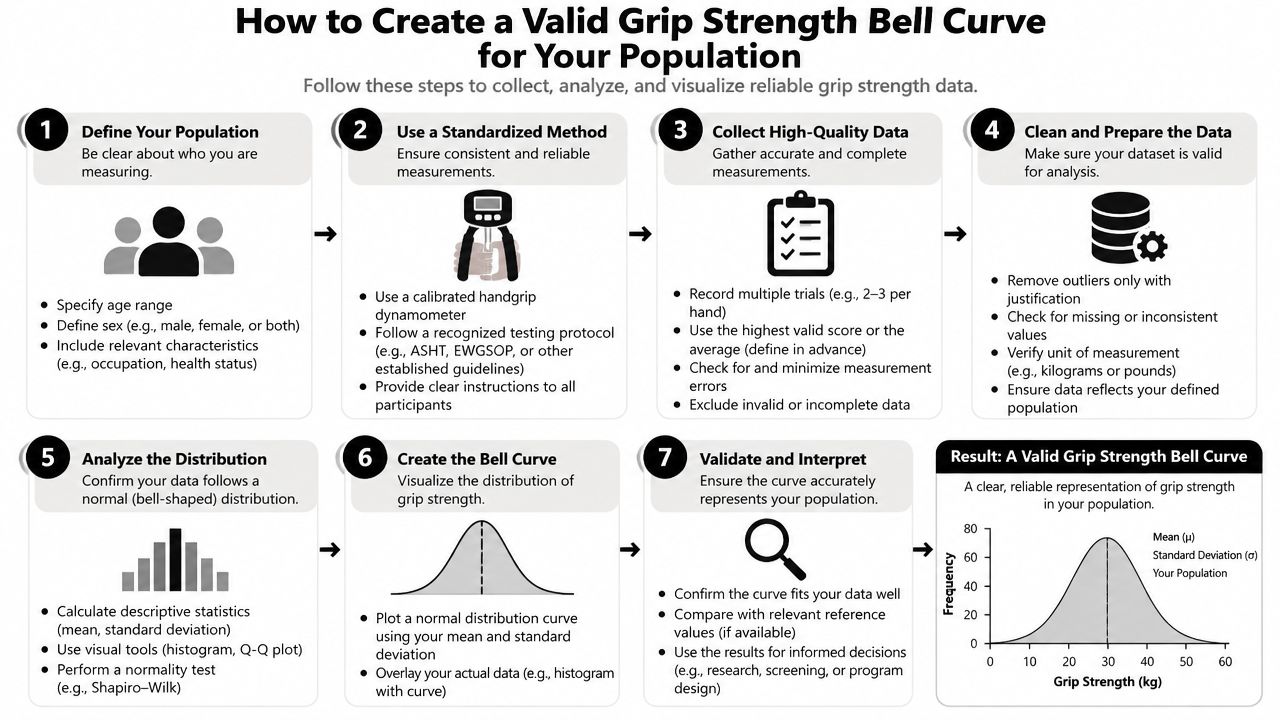
A valid curve starts with clean, protocol-matched data, not with a graphing tool. The goal is to produce a distribution that reflects the population you care about, whether that's an occupational cohort, a university sample, or a service-specific rehabilitation group. The more heterogeneous the group, the more careful the stratification needs to be.
Build the sample before building the curve
The first decision is whether to use an existing UK reference or create a local curve. If the service is benchmarking against the general adult population, the published UK norms are usually the sensible starting point. If the question is narrower, such as a fit-for-duty cohort in a specific organisation, a local distribution may be more useful because it reflects the actual workforce rather than a broad national reference.
The second decision is exclusion. If the sample includes missing data, inconsistent test positions, or people who don't belong in the target population, the curve stops being a clean reference. That's why the UK Biobank analysis matters conceptually, because it shows how a large dataset can be narrowed to a reference sample before normative values are derived (UK Biobank normative values).
The Chester Treadmill Test Software is a useful example of how standardised software supports professional measurement workflows, with web-based prediction, PDF export, a line of best fit, and an integrated PAR-Q form. The same logic applies to grip testing software and spreadsheet templates, consistency matters more than visual polish.
Plot and stratify with care
For grip data, left and right hands are often handled separately, especially in adult populations where dominance matters. Histograms show the raw shape, while smoothed centile curves make interpretation easier across age bands. The professional mistake is to over-smooth a messy dataset and call it normal.
A small occupational health cohort may be better served by centiles within broad age bands rather than an overfitted curve. A university lab dataset can often support more refined stratification, provided the testing protocol is tight and the devices are consistent. In both cases, the report should describe the hand tested, the number of trials, and the decision rule used to summarise performance.
Practical rule: if a local curve is built, keep the protocol constant from day one or the distribution will drift for reasons that have nothing to do with physiology.
Centiles and z-scores are only meaningful if the sample was assembled with the same discipline. A curve built from mixed devices, mixed postures, and mixed trial rules is not a reference curve, it's a collection of unrelated numbers with a graph on top.
How to Read and Interpret Centiles Z Scores and Standard Deviations
The useful move is to stop reading the score as a verdict and start reading it as a position. A centile tells you how a person compares with others in the same reference group, while a z-score tells you how far the result sits from the mean in standard deviation units. Those are related, but they answer slightly different questions.
| Interpreting Grip Strength Position on the Bell Curve | ||
|---|---|---|
| Position on Curve | Statistical Definition | Practical Interpretation |
| Near the centre | Close to the mean and median | Typical for the matched reference group, assuming protocol fit |
| Lower-middle band | Below the mean but not in the tail | May be acceptable, but the result deserves context from age, sex and function |
| Lower tail | Several standard deviation units below the mean | More likely to trigger screening, retest or referral, depending on setting |
| Upper-middle band | Above the mean without being extreme | Common in stronger, better-conditioned or larger-framed individuals |
| Upper tail | Far above the centre of the distribution | Unusual but not automatically problematic, especially in performance settings |
How to translate the score
Centiles are usually easier for non-statistical readers because they sound like rank. A result on a low centile means the person sits below most of the matched reference group, but it doesn't automatically mean disease or dysfunction. The interpretation only becomes stronger when the result is repeated under the same protocol, or when it aligns with other functional findings.
Standard deviations help when a service wants a more quantitative description. A score that sits well below the mean is more notable than one that misses the average by a small margin. In reporting terms, that difference matters because not every “below average” result requires action, and not every apparently acceptable result is reassuring.
What not to do
The mean is not a target. A person doesn't need to hit the centre of the bell curve to be healthy, fit for duty, or functionally capable. Nor should a single low reading be over-interpreted when the protocol changed, the person was fatigued, or the test was not repeated.
A report avoids inflated language and sticks to the data. For example, “below the matched reference median” is more careful than “weak”, and “near the lower tail of the distribution” is more defensible than “failing”, unless the setting uses a pass fail rule. That distinction becomes especially important in occupational and research contexts where language affects decisions.
Clinical and Occupational Cutoffs and When to Use Them
A bell curve is not always the final decision tool. Some settings need a criterion-referenced cutoff, not a population comparison, and that's where grip testing becomes more like a functional gatekeeper than a descriptive measure. The Scottish Prison Service standards show how concrete this can be, requiring grip dynamometry for both hands with minimum values of 32 kgf for the dominant hand and 30 kgf for the non-dominant hand (Scottish Prison Service fitness standards.doc)).
Distribution or threshold
A bell-curve approach is useful when the question is relative standing. A cutoff is better when the question is whether the person clears a duty requirement, rehabilitation gate, or screening threshold. Those are different decisions, and mixing them leads to poor reporting.
Occupational health teams often need both. The centile position explains how the person compares with a matched population, while the threshold explains whether the person meets a required minimum. In a duty-for-role context, the pass fail standard usually takes priority, but the curve still adds value because it explains how close the case is to the boundary.
When low scores need more than a note
Low grip strength should not be written off as a hand-only problem when the rest of the assessment suggests broader weakness. In that setting, grip sits naturally alongside the Chester Step Test for aerobic capacity, back and leg strength measures for trunk and lower-limb force, and anthropometry for body size context. That combined view is often more useful than a single test in isolation, especially where work demands are physical.
The wording in a report should stay precise. A score below the expected range may justify retesting, comparison with the other hand, or referral into a more complete physical assessment. A score below an occupational minimum should be described plainly, with the rule and the measurement method attached, so the result can be audited later.
A pass fail threshold is a decision rule. A centile is a context rule.
That's the cleanest way to keep the two systems separate. Use the threshold when the job requires it, and use the bell curve when the goal is to understand where the person sits among similar people.
Quick Reference Toolkit Cross References and Professional Resources
The quickest way to use grip dynamometry well is to standardise the language before the testing starts. Normative data means the matched reference group. A centile means the person's rank in that group. A z-score means distance from the mean. A criterion cutoff means a required minimum. If the report writer can define those four terms cleanly, the rest of the interpretation is easier to defend.
Protocol checklist for routine use
- Match the device: Keep the dynamometer model consistent with the reference data used.
- Match the posture: Seated and standing data should not be treated as identical unless the norm set supports it.
- Match the hand rule: Decide in advance whether dominant, non-dominant, or both hands are required.
- Match the trials: Use the same repetition and summary rule every time.
- Record the reference: State which normative source or occupational standard was used.
Reporting phrase bank
- Matched reference language: “Result sits within the expected range for the relevant reference group.”
- Borderline language: “Score lies near the lower tail of the matched distribution.”
- Functional language: “Result does not meet the occupational minimum for the tested hand.”
- Follow-up language: “Repeat testing under identical protocol is advised before stronger conclusions are drawn.”
Cross-reference map for broader assessment
Grip testing works best when it sits inside a broader profile. Back and leg strength help identify trunk and lower-limb force capacity, body composition and anthropometry explain size-related variation, and aerobic fitness testing, including the Chester Step Test, adds a separate view of cardiorespiratory capacity. For services that need repeatable hardware across these domains, the Takei Back and Leg Dynamometer is relevant because it gives a matched option for trunk and leg strength alongside grip testing equipment.
Professional software matters too, because the value of a curve rises when the history is stored cleanly and the same protocol is applied each time. That's advantage of a measurement system, not a single number on the day, but a trail of comparable results that can be checked, retested, and reported with confidence.
Cartwright Fitness supplies professional assessment equipment, software and training for grip strength, body composition, aerobic fitness and wider functional testing, all in the same measurement-focused workflow. For occupational health, physiotherapy, sports science and research teams that need validated tools and defensible reporting, visit Cartwright Fitness to review the equipment and solutions that support protocol-matched assessment.


