

To figure out inter-rater reliability, you're essentially measuring how consistently two or more independent raters evaluate the same thing. This means picking the right statistical tool for the job—like Cohen's Kappa for categories or an Intraclass Correlation Coefficient (ICC) for continuous measurements—and running the numbers. The whole point is to see if your raters are on the same page and applying the scoring rules uniformly.
What Is Inter-Rater Reliability and Why Should You Care?

Before we get tangled up in the formulas, let's break down what inter-rater reliability (IRR) really is. Think of it as a measure of consensus. It answers a simple but critical question: how much do my observers, judges, or raters actually agree with each other? Without solid agreement, your data is built on a shaky foundation of subjective interpretation.
Picture this: two personal trainers are scoring a client's squat form. Trainer A keeps rating the form as "excellent," but Trainer B consistently scores it as "poor." This major disagreement is a red flag. Is the scoring rubric too vague? Are they focusing on completely different parts of the movement? Low IRR like this means your data is noisy, unreliable, and ultimately, not very useful.
The Bedrock of Trustworthy Data
High inter-rater reliability is the foundation of any credible data, especially when there's an element of human judgment involved. It’s what gives you confidence that the variations in your data are real differences in what you're measuring, not just random inconsistencies between the people doing the measuring.
This isn't just a fitness or sports science issue; it’s a universal principle. Consider these scenarios:
- Clinical Settings: Two radiologists looking at the same X-ray must agree on a diagnosis for it to be considered reliable.
- Sports Officiating: Judges at a gymnastics meet have to score routines consistently. Otherwise, the final rankings are unfair.
- Academic Research: When multiple researchers are coding qualitative data, like interview transcripts, they must apply their codes in the same way to produce valid results.
A strong IRR score proves your measurement system works and that your raters are all speaking the same language. It means that if you brought in another trained rater, they would likely come to the same conclusions. This kind of replicability is the cornerstone of good science.
Going Beyond a Simple Headcount of Agreement
You might be tempted to just calculate a simple percentage of agreement. It seems easy enough, right? But this old-school method has a massive flaw: it doesn’t account for agreement that could happen purely by chance. This is exactly why statisticians developed more sophisticated tools.
Statistics like Cohen's kappa, which Jacob Cohen introduced way back in 1960, were designed specifically to correct for this chance agreement. Kappa gives you a score from -1 (total disagreement) to +1 (perfect agreement), providing a much more honest picture of reliability.
The demand for consistent, high-quality data is only growing, especially in complex fields. For instance, consistent data interpretation is a major focus in collaborative research in computational neuroscience, where large teams dissect intricate datasets. At the end of the day, a high IRR score isn't just some statistical box to check—it's what makes your data trustworthy.
Picking the Right Statistic for the Job
So, how do you choose the right tool? It all comes down to your data. Are you working with categories (like "good," "fair," "poor") or continuous numbers (like degrees of knee flexion or time in seconds)? Knowing the answer is the first step to selecting the appropriate statistic.
Here's a quick rundown of the most common IRR statistics to help you decide.
Quick Guide to Common Inter-Rater Reliability Statistics
| Statistic | Best For… | Number of Raters | Data Type |
|---|---|---|---|
| Cohen's Kappa | Assessing agreement between two raters on categorical judgments. | Two | Nominal |
| Fleiss' Kappa | An adaptation of Cohen's kappa for situations with three or more raters. | Two or more | Nominal |
| Intraclass Correlation (ICC) | Measuring agreement for continuous data. It's great for assessing consistency in ratings or measurements. | Two or more | Ordinal, Interval, Ratio |
| Krippendorff's Alpha | A very flexible statistic that can handle any number of raters and various data types, including missing data. | Two or more | Nominal, Ordinal, Interval, Ratio |
| Kendall's W | Evaluating agreement among multiple raters when they are ranking a set of items. | Three or more | Ordinal |
Choosing the correct statistic from this list is crucial. Using a tool meant for categorical data on your continuous measurements (or vice versa) will give you meaningless results and could lead you to draw the wrong conclusions about your data's reliability. Always match the statistic to your specific research question and data type.
Choosing the Right Statistic for Your Data
Getting your inter-rater reliability calculation right starts with one crucial decision: selecting the correct statistical test. Honestly, this is the most important choice you'll make in the whole process. If you pick the wrong one, your results will be meaningless. It's like trying to measure someone's body fat percentage with a stopwatch—the number you get just won't make sense.
So, how do you pick the right one? It all boils down to two things: the type of data you're working with (is it in categories or on a scale?) and how many raters you have. Let's cut through the statistical jargon and make this straightforward.
This decision tree gives you a quick visual guide to find the right path for your specific project.
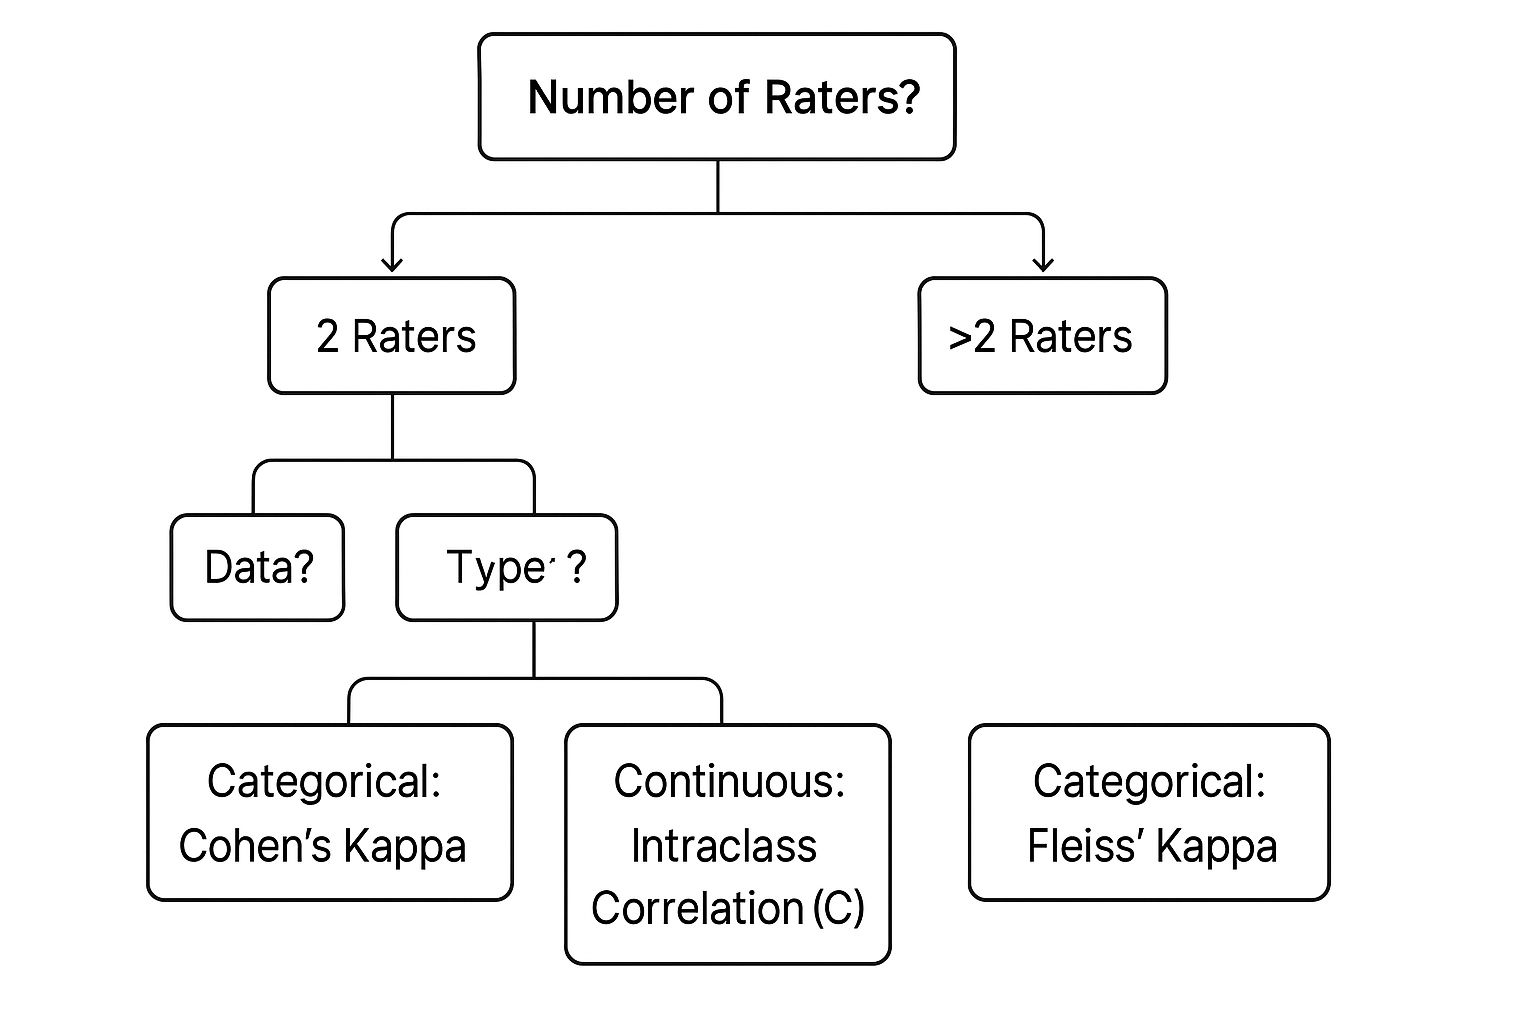
As you can see, the choice really hinges on whether you have two or more raters and if your data is categorical (like "pass/fail") or continuous (like a score from 1-100).
The Big Three IRR Statistics
While there are plenty of statistical tests out there, the truth is, most scenarios you'll encounter in fitness or clinical work can be handled by one of three big players: Percent Agreement, Cohen's Kappa, or the Intraclass Correlation Coefficient (ICC). Understanding what each one does best is key.
1. Simple Percent Agreement
This is the most basic measure of them all. You just count how many times your raters agreed and divide it by the total number of things they rated. It's easy to calculate, but it has a massive flaw: it doesn’t account for agreement that could happen by pure chance.
For example, if two trainers are judging a movement with only two options ("Good" or "Poor"), they'll agree 50% of the time just by guessing. Percent agreement can give you a false sense of security with a high number, which is why it's not robust enough for any serious research. I'd only recommend it for quick, informal checks, maybe during the initial phases of rater training.
2. Cohen's Kappa (κ)
When you're dealing with categorical data, Cohen's Kappa is a much sharper tool. It really shines when you have two raters and your data fits into clear, separate categories (what statisticians call nominal data).
The biggest advantage of Kappa is that it specifically corrects for the random chance agreement that makes simple percent agreement so weak. A Kappa score of 0 means the agreement is no better than a coin flip, while a score of 1 signifies perfect agreement.
When to Use Cohen's Kappa: Imagine two physical therapists watching videos of a client's single-leg squat. They classify each attempt as either 'Correct' or 'Incorrect'. With two raters and two distinct categories, Kappa is the perfect statistic to measure their consistency beyond what could be attributed to random luck.
If you have more than two people rating categorical data, you'd just use a slight variation called Fleiss' Kappa.
When Your Data Is on a Scale, Use ICC
What if your ratings aren't simple labels but actual numbers on a scale? That's where you need to switch tools. The Intraclass Correlation Coefficient (ICC) is your go-to.
3. Intraclass Correlation Coefficient (ICC)
The ICC is the gold standard for continuous or ordinal data (think scores, times, or measurements). It's incredibly flexible and works perfectly whether you have two or more raters. If your raters are assigning scores instead of just labels, this is what you should be using.
The ICC works by comparing the variation between the subjects being rated to the total variation across all the ratings. Put more simply, it tells you how much of the difference in scores is due to genuine differences in performance versus just inconsistencies between your raters.
Here are a few classic fitness scenarios where the ICC is the only way to go:
- Performance Ratings: Three gymnastics coaches rate an athlete's routine on a scale of 1 to 10.
- Flexibility Scores: Two clinicians use a goniometer to measure a client's hip flexion in degrees.
- Subjective Effort: Raters score an athlete's perceived exertion during one of the many types of aerobic fitness testing.
In all these cases, the data is numerical and exists on a scale, making the ICC the superior method. It gives you a single value, usually between 0 and 1, that neatly summarizes the level of consistency and agreement among your raters.
Picking the right statistic doesn't need to be a headache. By first identifying your data type and how many raters you have, you can confidently choose the right method. This ensures your inter-rater reliability analysis—and the conclusions you draw from it—are built on a solid statistical foundation.
Let's Walk Through Cohen's Kappa with a Real-World Example

When you're dealing with two raters and categorical data (like 'pass/fail' or 'good/fair/poor'), Cohen’s Kappa is the go-to statistic. It’s a huge step up from just calculating a simple percentage agreement because it cleverly factors out the agreements that could have happened just by dumb luck. What you're left with is a much truer measure of how consistent your raters really are.
Theory is one thing, but let's get our hands dirty with a practical scenario.
Imagine two of your senior trainers, Alex and Ben, are evaluating videos of a new client performing a movement screen. They have to watch 50 short clips and classify each one as either 'Correct' or 'Incorrect' based on your gym's specific performance criteria. They do this independently, of course.
Once they've both gone through all 50 videos, it's time to see if they're on the same page.
First, We Build a Contingency Table
The starting point for any Kappa calculation is organizing the data into a contingency table. Think of this as your scorecard—it lays out every single agreement and disagreement in a simple, visual format.
Here’s the breakdown of how Alex and Ben rated the 50 videos:
- They both said 'Correct' on 20 clips.
- They both said 'Incorrect' on 15 clips.
- Alex said 'Correct' but Ben said 'Incorrect' on 7 clips.
- Alex said 'Incorrect' but Ben said 'Correct' on 8 clips.
Now, let's pop those numbers into a 2×2 table.
| Ben: Correct | Ben: Incorrect | Alex's Total | |
|---|---|---|---|
| Alex: Correct | 20 | 7 | 27 |
| Alex: Incorrect | 8 | 15 | 23 |
| Ben's Total | 28 | 22 | 50 (Grand Total) |
The diagonal cells (20 and 15) are where they agreed. The other two cells (7 and 8) are the disagreements. Don't forget the row and column totals; we'll need those in a minute.
Calculating Observed Agreement (Po)
This is the straightforward part. The observed agreement, or Po, is just the proportion of times Alex and Ben actually gave the same rating. It's what most people think of as percent agreement.
You just add up the agreements and divide by the total number of videos.
- Total Agreements: 20 (Correct/Correct) + 15 (Incorrect/Incorrect) = 35
- Total Observations: 50
- Calculation: Po = 35 / 50 = 0.70
So, on the surface, Alex and Ben agreed 70% of the time. Not bad, right? But the real question is, how much of that agreement was just pure chance?
Calculating Chance Agreement (Pe)
Here’s where Cohen’s Kappa really shines. We need to figure out the probability that they would have agreed by chance alone. This is called Pe, and it’s what separates Kappa from more basic metrics.
To find Pe, we calculate the probability of them both randomly saying 'Correct' and the probability of them both randomly saying 'Incorrect', then add those two values together.
- Chance Agreement on 'Correct': (Alex's 'Correct' Total / Grand Total) * (Ben's 'Correct' Total / Grand Total) = (27 / 50) * (28 / 50) = 0.54 * 0.56 = 0.3024
- Chance Agreement on 'Incorrect': (Alex's 'Incorrect' Total / Grand Total) * (Ben's 'Incorrect' Total / Grand Total) = (23 / 50) * (22 / 50) = 0.46 * 0.44 = 0.2024
Now, we add them up to find the total probability of them agreeing by chance.
Pe = 0.3024 + 0.2024 = 0.5048
This is a huge insight. It tells us we could expect Alex and Ben to agree on about 50.5% of the ratings just by guessing! Simple percentage agreement completely misses this crucial context.
Putting It All Together: The Kappa Formula
We have everything we need. The formula for Kappa is κ = (Po – Pe) / (1 – Pe).
Let's plug in our numbers:
- Po (what we saw) = 0.70
- Pe (what we'd expect from chance) = 0.5048
κ = (0.70 – 0.5048) / (1 – 0.5048)
κ = 0.1952 / 0.4952
κ = 0.394
Our final Kappa score is 0.394. This is a much more honest picture of their consistency than the initial 70% we calculated. It indicates a "fair" level of agreement once you strip away the influence of chance. This level of detail is invaluable, especially when making subjective judgments in something like a submaximal exercise test.
The work done since the mid-20th century to develop stats like Cohen's Kappa has been instrumental in professionalizing fields that rely on human judgment. It forces us to be more rigorous. For a closer look at the evolution of these kinds of statistics, you can explore methodologies for evaluating consistency on PubMed. This history really drives home why simply looking at percentages isn't enough to produce credible, reliable data.
Mastering the Intraclass Correlation Coefficient (ICC)
When you're dealing with data that’s more nuanced than a simple 'pass' or 'fail'—like performance scores, physical measurements, or any kind of rating on a scale—Cohen's Kappa just won't cut it. You need a more sophisticated tool. This is precisely where the Intraclass Correlation Coefficient (ICC) shines, establishing itself as the gold standard for measuring inter-rater reliability with continuous or ordinal data.
The ICC is your go-to statistic anytime you have ratings on a scale (say, a performance score from 1-10) or when you have more than two people doing the rating. At its heart, the ICC works by dissecting all the variation in your data. It figures out how much of that variation is because of real differences in what's being measured, and how much is just "noise" created by inconsistent raters.
Understanding the Power of Variance
Let’s imagine three figure skating judges scoring a skater’s routine. If they give scores like 8.2, 8.5, and 7.9, the small differences are perfectly normal. But what if their scores were 9.5, 7.1, and 8.8? That massive spread signals a problem with consistency. The ICC quantifies this by analyzing the variance.
A high ICC score tells you that most of the variation in the scores is coming from genuine differences between the skaters—some are simply better than others. A low ICC, on the other hand, suggests that a big chunk of that variation is actually coming from the judges themselves being unreliable.
The math behind this is rooted in an Analysis of Variance (ANOVA) framework. You don't need to get lost in the complex formulas, but the concept is powerful. In statistical terms, reliability is the proportion of variance in the ratings that can be chalked up to the thing being measured, not random error or rater quirks. This framing, explored in publications like the Journal of the Royal Statistical Society, is what makes the ICC so robust.
Choosing the Right ICC Model
Here's where many people get tripped up: the ICC isn't a single, one-size-fits-all test. When you fire up any statistical software, it's going to ask you to pick a specific model. This choice is critical, and it depends entirely on your research design and what you’re trying to measure.
Your decision really boils down to two key questions:
- Are these specific raters the only ones I care about, or do they represent a larger pool of potential raters? This is the difference between "Fixed" and "Random" effects.
- Am I interested in whether the raters are consistent, or do I need their scores to be in absolute agreement? This is the "Consistency" vs. "Absolute Agreement" decision.
These questions lead you to different ICC "forms" and "types." For instance, if you want to know if a specific group of coaches agrees, you'd probably use a "fixed" model. But if you want to know if any trained coach would agree, you need a "random" model.
Key Takeaway: The type of ICC you select matters immensely. Don't just click the default option. Think about whether you need to know if your raters are just ranking subjects in the same order (consistency) or if they are giving the exact same scores (absolute agreement). For most practical uses, like ensuring clinical measurements are interchangeable, absolute agreement is the one you want.
Calculating ICC with Cartwright Fitness Tools
Let's be honest, calculating the ICC by hand is a nightmare. It’s a task best left to software. The good news is you don’t need a PhD in statistics to get the right answer. Our own Cartwright Fitness IRR Calculator was built to make this process incredibly straightforward.
You can see for yourself how easy it is to plug in your data and get an immediate result.
Instead of wrestling with complex software, you just enter your raters' scores for each subject, choose the ICC model that fits your study, and get your reliability coefficient in seconds. This screenshot shows just how clear the interface is, letting you input scores from multiple raters for various subjects without any hassle.
Let's go back to our three figure skating judges. Say they've rated 10 different skaters. We would input all 30 scores (3 judges x 10 skaters) into the calculator. We'd then select our ICC model—in this case, likely a two-way random effects model for absolute agreement—and hit calculate. The tool instantly provides a single ICC value and a 95% confidence interval, which gives you a realistic range for the true reliability score. That immediate feedback is invaluable for quickly assessing whether your measurement protocol is solid or if your raters need more training.
What to Do With Your Results (and How to Take Action)

You’ve done the hard part—you’ve run the numbers and now you’re staring at an inter-rater reliability score. Whether it's a Kappa or an ICC value, the real question is, what does this number actually mean for your work? Crunching the numbers is one thing, but interpreting the result is where the true value lies. This is how you turn a simple statistic into a powerful tool for quality control.
First things first, you need to understand where your score fits on the spectrum from poor to perfect. This gives you an immediate sense of how well your raters are aligning.
Standard Interpretation of Kappa and ICC Values
Most researchers and practitioners rely on a standard scale to give meaning to their reliability scores. While you might see slight variations out in the wild, the table below is a solid, widely accepted reference for both Cohen's Kappa and ICC values.
| Value Range | Level of Agreement |
|---|---|
| < 0.00 | Poor |
| 0.00 – 0.20 | Slight |
| 0.21 – 0.40 | Fair |
| 0.41 – 0.60 | Moderate |
| 0.61 – 0.80 | Substantial |
| 0.81 – 1.00 | Almost Perfect |
This table provides a great starting point. A score of 0.85 is clearly fantastic, signaling “Almost Perfect” agreement. On the other hand, a score of 0.35 falls into the “Fair” category, which should be a red flag that something needs attention. Too many people stop here, but that's a huge mistake.
A reliability score isn't just a number to stick in a report—it's a diagnostic tool. The real magic happens when you understand what that score means within the specific context of your project.
Why Context Is Everything
A single number rarely tells the full story. The "acceptability" of a reliability score is completely dependent on what's at stake. What might be a great score in one situation could be dangerously low in another.
Let's look at a couple of real-world scenarios:
Low-Stakes: Imagine two marketing interns are sorting customer feedback into 'Positive' and 'Negative' piles. They achieve an ICC of 0.70, which is "Substantial" agreement. For this task, that's probably great! A few disagreements aren't going to sink the ship.
High-Stakes: Now, picture two clinicians using an ultrasound device to assess an athlete's body composition to create a critical treatment plan. An ICC of 0.70 here is alarming. The potential consequences of inconsistent measurements—like a wrong diagnosis or ineffective protocol—are far too high. In this case, you'd want to see a score well above 0.90.
The precision of your interpretation matters immensely, whether you're dealing with subjective ratings or more objective measures. Learning how to properly interpret your findings, much like interpreting physiological data like heart rate variability, is a cornerstone of responsible and effective practice.
What to Do When Your Reliability Score Is Low
Getting a low score isn't a failure—it's feedback. It’s a clear signal that something in your measurement process is off. The good news? You can fix it. If your IRR is lower than you’d like, it's time to roll up your sleeves.
Here are the most effective ways I've found to improve rater consistency:
1. Sharpen Your Operational Definitions
Low agreement often stems from vague criteria. Your raters might simply be interpreting the same term differently. Go back to your scoring guide and make it painfully clear.
- Vague: "Score the squat as 'Good' if form is solid."
- Specific: "A squat is scored as 'Good' ONLY if the hips descend below the knees, the lumbar spine remains neutral, AND the heels stay flat on the floor."
2. Bolster Your Rater Training
Think of your raters as precision instruments that need to be calibrated. A one-off training session rarely cuts it.
- Run group training sessions where raters can talk through tricky examples and align their thinking.
- Give them a "gold standard" set of rated examples to practice with, followed by direct feedback.
- Schedule regular check-ins or refresher courses to prevent "rater drift"—a slow, unintentional deviation from the standard over time.
This process of alignment is similar to establishing a baseline for what’s considered ‘normal’ in a population. If you’re interested in creating these kinds of benchmarks, our article on https://www.cartwrightfitness.co.uk/what-is-normative-data/ offers some fantastic insights.
3. Rethink Your Scoring Rubric
Sometimes the tool itself is the problem. A well-designed rubric or checklist should minimize subjective guesswork.
- Instead of broad quality scales (e.g., 1-5), try using simple checklists with binary (Yes/No) items.
- Include visual aids like photos or short video clips showing clear examples of each scoring level.
- Always pilot test your rubric on a small sample before a full rollout to catch any confusing parts early.
By moving beyond just reporting a number, you can transform your inter-rater reliability analysis into a practical strategy for building a more robust and trustworthy data collection process. It’s how a simple statistical exercise becomes a powerful engine for genuine improvement.
Answering Your Top Inter-Rater Reliability Questions
As you dive into the world of inter-rater reliability, you're bound to have some questions. It’s a normal part of the process, and sorting through these common sticking points is a sign you're on the right track. Let's walk through some of the hurdles I see practitioners and researchers face all the time and give you clear, straightforward answers to keep you moving forward.
Inter-Rater vs. Intra-Rater: What's the Difference?
It’s incredibly easy to get these two terms mixed up, but they measure two completely different kinds of consistency. Getting this right is fundamental to designing solid research or a trustworthy assessment protocol.
Inter-Rater Reliability (IRR): This is all about agreement between two or more different people. Think of it as a check for consensus. If you have two trainers, Alex and Ben, watching the same client perform a squat, IRR tells you how consistently they score that movement. Are they on the same page?
Intra-Rater Reliability: This, on the other hand, measures the consistency of one single person over time. If Alex rates a video of a squat today and then rates that exact same video again next week, will his scores be consistent? This is a check for stability in an individual’s own judgment.
So, to put it simply: IRR is about consistency across different people, while intra-rater reliability is about one person's consistency with themself.
How Do I Handle More Than Two Raters?
This comes up a lot. Many studies and practical settings, especially in team environments, involve a whole group of observers, not just a pair. While Cohen's Kappa is a fantastic tool for two raters, it's just not built for three or more.
Luckily, we have other powerful statistics designed for exactly this situation. Your choice really boils down to the type of data you're working with.
For Categorical Data: When your team is assigning observations to distinct categories—like 'Poor,' 'Fair,' or 'Good' form—you'll want to use Fleiss' Kappa. It’s essentially an extension of Cohen's Kappa, built specifically for larger groups of raters.
For Continuous or Ordinal Data: If your raters are using a numerical scale, like a 1-10 performance score or a flexibility measurement, the Intraclass Correlation Coefficient (ICC) is your best friend. The ICC is incredibly versatile and robust, handling data from two or more raters with no problem.
What’s a Good Sample Size for My Study?
This is the classic "how long is a piece of string?" question in reliability studies, and the honest answer is that there's no single magic number. The right sample size depends on a few things, like how complex the task you're rating is, the number of categories you're using, and the level of agreement you expect to find.
However, from experience, a great best practice is to pilot test your system first. I always recommend analyzing a subset of 10-20% of your total data as a starting point. This gives you a chance to spot major disagreements and retrain your raters before you’ve sunk hundreds of hours into coding an entire dataset incorrectly. You just need enough data to feel confident that your reliability score is stable and truly reflects your system.
A low reliability score isn't a dead end. Don't panic. It’s not a failure—it's an opportunity. It's a clear signal that something in your measurement process, whether it's the training or the rubric itself, needs to be refined.
My Reliability Score Is Low. What Do I Do Now?
Seeing a low Kappa or ICC score can definitely be a gut punch, but it’s a fixable problem. Think of the score as a diagnostic tool. It's simply telling you that your raters aren't aligned, and your job is to figure out why.
Here's a practical troubleshooting checklist I've used time and again:
- Revisit the Rubric. Are your definitions truly crystal clear? Vague terms like "good form" or "moderate effort" are usually the main culprits. Go back and refine your scoring criteria with specific, observable, and non-negotiable points. What does "good" actually look like?
- Run Targeted Retraining Sessions. Get your raters in a room together. Walk through the scoring criteria again and have them practice on a few "gold standard" examples where the correct rating is already known. This is your chance to talk through any disagreements and get everyone calibrated.
- Clarify the Edge Cases. Most disagreements don't happen on the obvious examples; they happen on the tricky, borderline cases. Create a quick reference guide or hold a meeting just to hash out these scenarios and decide on a clear protocol for how to handle them.
By systematically working through these areas, you can dramatically improve your raters' consistency and, ultimately, the trustworthiness of your data.
When precision is non-negotiable, having the right tools is paramount. Cartwright Fitness provides high-quality, validated testing equipment to ensure your measurements are as accurate and reliable as your research demands. Explore our professional-grade solutions.


